Visual
Symbols
-are
representations of direct reality, which comes in the form of signs and
symbols.


DRAWINGS
-a drawing may not be real
things but better to have a concrete visual aid than nothing. To avoid
confusion, it is good that our drawing correctly represents the real thing.

CARTOONS
-another useful visual
symbol that can bring novelty to our teaching is the cartoon. A first-rate
cartoon tells its story metaphorically.

STRIP
DRAWINGS
-a sequence of drawings in a
newspaper, magazine, etc., relating a humorous story or an adv enture.
enture.
DIAGRAMS
-it is any line drawing that
shows arrangement and relations as of parts to the whole, relative values,
origins and development, chronological fluctuations, distributions, etc.,
TYPES
OF DIAGRAMS
Affinity
Diagram- used to cluster complex apparently unrelated data into
natural and meaningful groups.

Tree
Diagram- used in increasing details or various tasks that must
be accomplished to complete a project.

Fishbone
Diagram- cause-and- and effect diagram.

Charts
-Is a diagrammatic
representation of relationships among individuals within an organization. We
can have different types of chart:
1. Time chart – is a tabular time chart that presents data in ordinal
sequence.

2. Tree or stream chart – Depicts development, growth and change by
beginning with a single course ( the trunk ) which spreads out to many branches
or by beginning with the many tributaries which then converge into a single
channel.

3. Flow chart – Is a visual way of charting or showing a process from
beginning to end. It is a means of analyzing a process. By outlining every step
in a process, you can begin to find inefficiencies or problems.

4. Organizational chart – shows how one part of the organizational
relates to other parts of the organization.

5. Comparison and contrast chart – Used to show similarities and
differences between two or three things.

6. Pareto chart – Is a type of
bar chart, prioritized in descending order of magnitude or importance from left
to right. It shows at a glance which factors are occurring most.

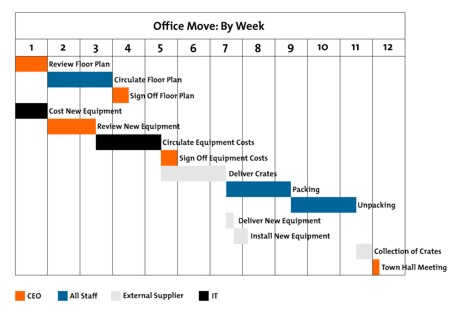
7. Gannt chart – Is an activity time chart.
GRAPHS
-pictures that help us
understand data.
There are several types of
graphs. They are:
Circle
or pie graph
-Recommended for showing
parts of whole.
Bar
graph
- Used in comparing the
magnitude of similar items at different ties or seeing relative sizes of the
parts of a whole.
Pictorial
graph
- Makes use of picture
symbols.

Line
graph
Graphic Organizer – an
informal organizer

MAPS
- Is a “ representation of
the surface of the earth or some part of it.”
Kinds
of Map
1. Physical map – Combines in a single projection data like
altitude, temperature, rainfall, precipitation, vegetation and soil.

2. Relief map – Has three dimensional representations and show
contours of the physical data of the earth or part of the earth.

3. Commercial or economic map – Also called product or industrial map since they show land areas in relation to the economy.

4. Political map – gives detailed information about country,
provinces, cities and towns, roads and highways. Oceans, rivers and lakes are
the main features of most political maps.

POSTER
-a large printed picture used for decoration
Walang komento:
Mag-post ng isang Komento